

Zero2Automated - January 2023 Challenge
We've been seeing a flow of first stagers flying around on Twitter in the form of a OneNote document, so why don't we all have a look..
I wrote this post as I thought it would be fun to explore some reverse engineering techniques — in (almost) simplified terms! Typically, patching can be used to bypass detection methods employed by strung malware authors who want to add on a bit of challenge to slow down and increase the difficulty of analysis.
Even with something as simple as IsDebuggerPresent or Sleep or complex techniques such as the use of Structured Exception Handlers, you can apply these methods to defeat the defences employed by malware which would otherwise lead to undesirable results. When it also comes to slightly more complicated detection methods (use of the rdtsc instruction for time-based detection, Structured Exception Handling or hardware breakpoint detection), it is left to the analyst’s imagination as well as their knowledge and experience to defeat those mechanisms.
Using a plugin like ScyllaHide within x64dbg can be a massive shortcut — it may prevent the debugger from being detected by the malware specimen, but that would not stop it from discovering specific things like parent processes, monitoring and analysis tools running or installed on systems, or utilising certain sequences of Assembly instructions that would reveal that it is being run inside a virtual machine. However, combining or applying either of these where you can would help you adapt to pretty much anything malware throws at you, and you become a much more effective reverse engineer. Repeat after me, patching is applying duct tape to all your problems logic!

A short disclaimer though, this post is intended to cover some basic techniques that will face off basic evasion methods. Unfortunately I will not cover topics such as devirtualising Assembly instructions as I am not yet on that level, but I possibly could in a future post.
That said, patching is pretty much a core task in any reverse engineer’s toolkit regardless of skill level, so allow me to take you through a few!
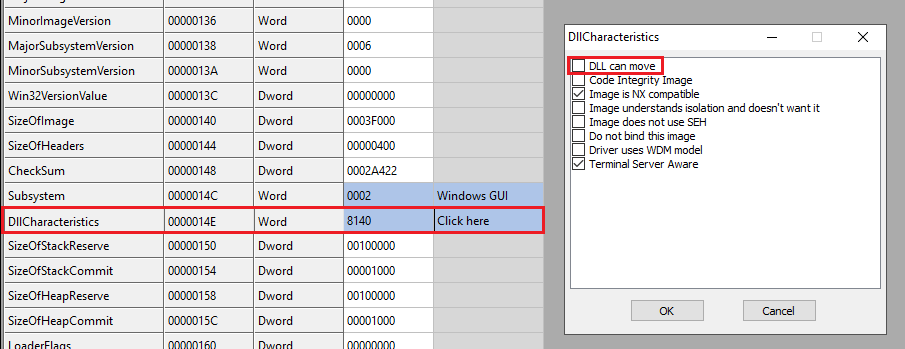
If you would like to follow along, feel free to download the IcedID sample within the References section of this post! You are invited to change the DLL can move property through CFF Explorer within DllCharacteristics!
Just like human beings, malware and software programs as a whole operate on logic, just without the feelings holding them back! To put it simply, programs are series of instructions that have a control flow based on the conditions of their environment (user input, running procesesses, OS-determined variables etc.) and change their behaviours to adapt based on those outcomes. Some may be within your control while others are not, but inside a debugger and disassembler, the world is yours to rule.

In the below psuedocode, let’s imagine the malware specimen had called an anti-debugger detection method, and the variable of the result was stored and checked to determine the next behaviours it would exhibit:
if (result == 1)
{
    // perform some code based on the successful if statement
}

else
{
    // do something else
    return 0;
}
Within Assembly, this code would be disassembled as the following:
cmp eax, 1
jz ResultWasOne
xor eax, eax ; XORing out eax would store 0 in the return value, and also indicate the conditional jump wasn't taken
ret

ResultWasOne:
xchg eax, eax ; perform some code based on the successful if statement
Changing jz to jnz cause the complete opposite effect to happen — the function ends up returning 0 (essentially performing the XOR operation on eax within Assembly) and moving the flow of the program to the caller of the function.
Within your tools, you can use graph views to determine where the jump actually goes and what happens based on this decision. To make your life slightly easier, do the following to show instruction addresses while in Graph View in IDA - Graph view > Options > General > Disassembly > Line prefixes (graph).
The colours of arrows can also be generally helpful for understanding the control flow of a program:
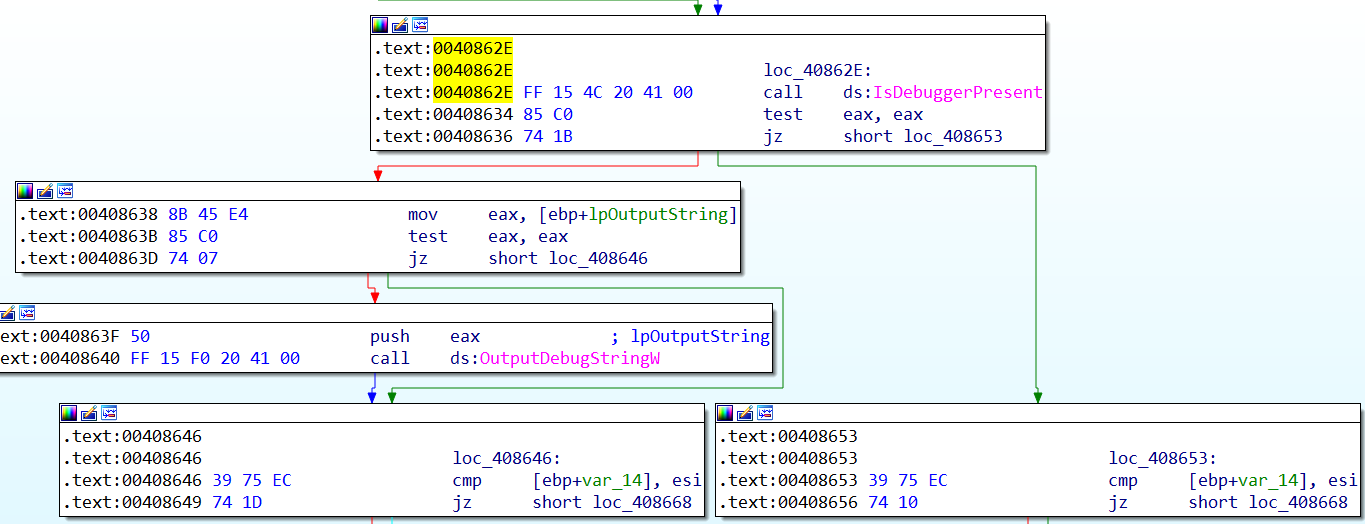
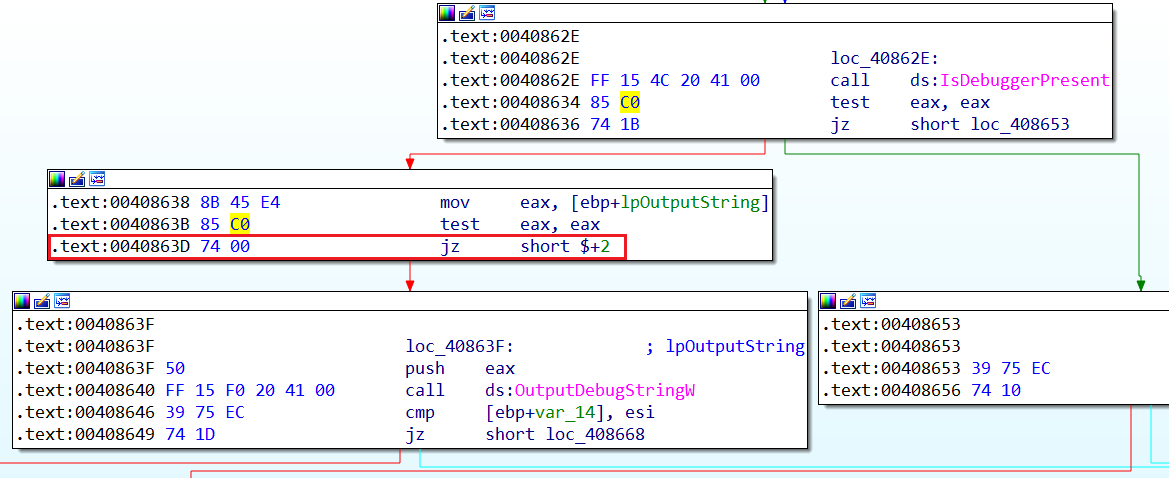
Inside the IcedID specimen, I will be covering the two anti-debugging techniques:
IsDebuggerPresent, which actually checks the PEB.BeingDebugged member within the PEB behind the scenes, and if it is set to 1, the return value is also 1 (reference).
The OutputDebugStringW method relies on the fact that if the process is being debugged, then the return value in eax would be a valid address inside the virtual address of the process, otherwise will be 0 or 1 as mentioned. Since 0 and 1 are not valid virtual addresses, if the program attempts to access those addresses, a memory access violation exception (exception code 0xC0000005) will occur, the execution will then be transferred to an exception handler and the program will be able to detect that the calling process is not debugged. If no exception occurs, then it means that the calling process is running under a debugger.
Notice how the opcodes (Options > General > Number of opcodes (graph) — set to 8) for each conditional jump inside each anti-debug technique changes within the screenshots:
Before:
After:
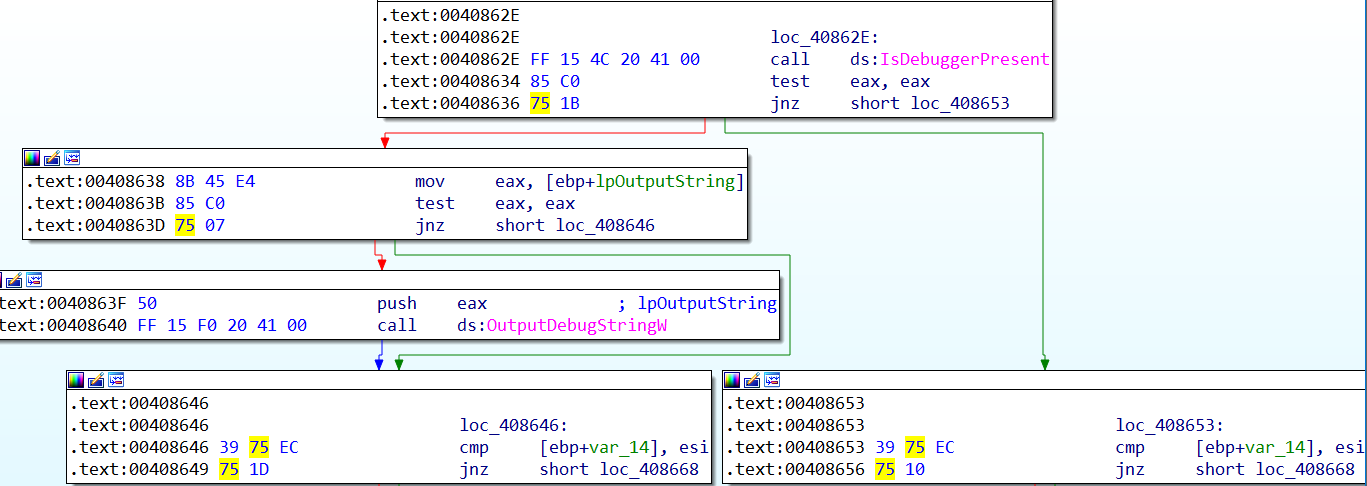
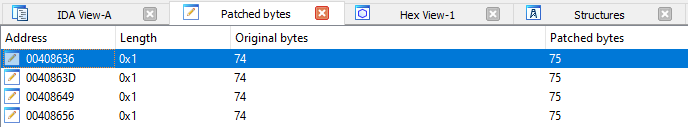
Reversing the logic of the instructions will cause the program to behave in the exact opposite way it was originally written. To keep track of your patched instructions, you can view them in IDA:
The nop instruction has many uses, and it is so versatile that it is being used by malware authors and reverse engineers alike! In exploit dev, nop sleds are normally used to allow malware to unpack their shellcode into unoccupied regions of memory within their target.

In malware development, its logic can also be used in a series of instructions to waste analysis time with calculations that land back to square one, such an example being push eax, xchg eax, eax add eax, 1, pop eax.
In the case of reverse engineering, filling an area of a program with a series of nop instructions is essentially replacing their opcodes with 90 and causing it to do absolutely nothing in that short region for the reward of everything your specimen has to offer!
Before:

After:
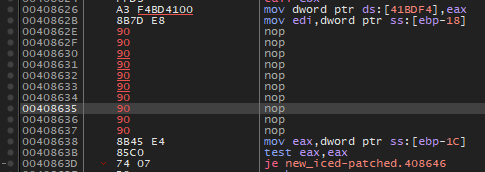

Notice how x64dbg fills the space occupied by the previous anti-analysis opcodes with that many bytes! Which takes us to the following section…
jz, jnz, jg, jl
These have one thing in common; apart from starting with a j, they are all assembly instructions for which their purpose in comparisons are facilitate conditional jumps, and they all have opcodes!
Here is an example of a conditional jump:
74 0774 stands for jz or je, and the argument causes the program to make a jump 07 bytes forward (moving the instruction pointer that many bytes away) if the ZF flag is not set to 1. Re-assembling the opcodes from 74 07 to 74 00 would essentially be a nop! To make better sense of it, here is a visualisation of what a patched jump would look like:

Notice the difference on the arrows as well as the jump destination!
This can also apply for unconditional jumps (jmp), but you must know where you’re landing to make sure you don’t break the program! On another note, being aware of opcodes can also be important if you want to write YARA rules for code reuse across malware within a campaign. Although you do not need to memorise them, here is a reference.
This method would be slightly more challenging, seeing as you would require some knowledge around the PE format (long live MSDN!)
To be successful with this method, you use the following equation to calculate the offset and directly edit a binary inside a hex editor:
Offset = VirtualAddress - (ImageBase + RelativeVirtualAddressOfSection) + PointerToRawData
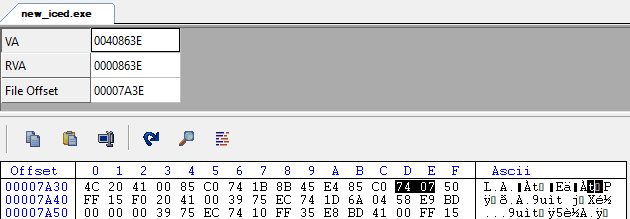
To start, you’d have to retrieve the virtual address from IDA or x64dbg — in this case, we will use 0x40863E, as this was one of the virtual addresses for the argument for the conditional jump spotted within the IcedID specimen.
Next, you would need the relative virtual address of the section (typically calculated through RelativeVirtualAddress = VirtualAddress - ImageBase) as well as the value stored within PointerToRawData. Detect It Easy simplifies finding this is as much as possible, although you can also have a look at the structure from MSDN.
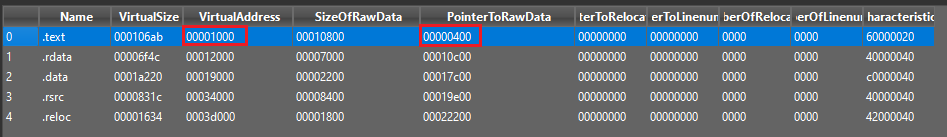
While we’re at it, we can also obtain the value of ImageBase, which is usually 0x400000 by default for 32-bit EXEs and 0x10000000 for DLLs (you can find out more here).
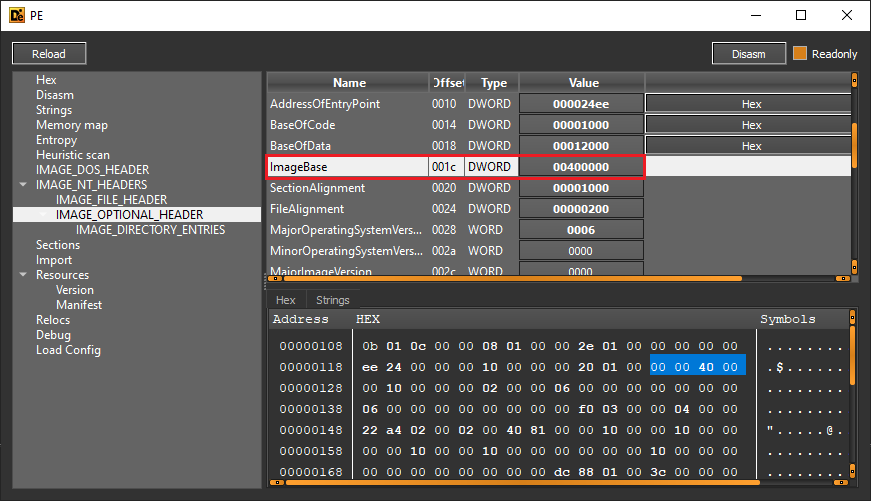
Finally, we are left with the final equation: Offset = 0x40863E - (0x1000 + 0x400000) + 0x400. To get the offset, we would perform the following inside a hex calculator, which can either be your regular RE tools or even the default Windows calculator:
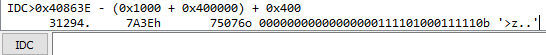
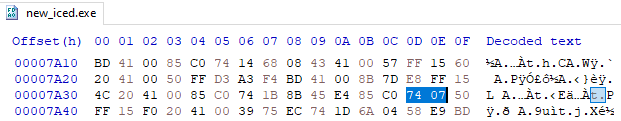
At offset 0x7A3E within HxD, we can see the exact instructions we were looking for!
You can also use tools such as CFF Explorer, PE-bear and even Python’s pefile module to patch binaries while they aren’t loaded into memory. Several of them even contain built-in offset calculators and hex editors!
Whether you use a disassembler, debugger, or even a simple hex editor, patching can help you circumvent anti-analysis detections used by malware. In the case of dnSpy, it can even be as simple as right-clicking an area of the program you don’t like, Edit IL Instructions, making the changes then saving the module to patch the binary (see an example here). This is even super effective against malware that attempts to verify checksums against its own executable sections to make double sure that it isn’t being analysed. If you run into trouble, you can always look at the mitigations recommended by Unprotect.it and CheckPoint’s Anti-Debug. You can also have a look at several anti-analysis techniques from an adversary’s point of view inside the Al-Khaser GitHub repo.
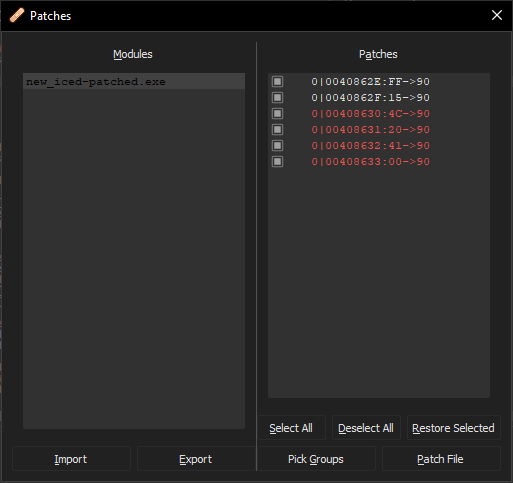
Whenever you are doing this via a debugger, make sure you also save the file, as the patches done will only apply for the one time the PE is loaded into memory! Inside x64dbg: File > Patch file:
If you found this post useful, please share it with other beginner reverse engineers who are just starting out, and feel free to reach out to me on any of my social media handles if you have any questions or comments on the post!
Mini-challenge: Try to change the DllCharacteristics field of the optional header without relying on CFF Explorer! Check here for clues.
SHA256: 76cd290b236b11bd18d81e75e41682208e4c0a5701ce7834a9e289ea9e06eb7e
https://bazaar.abuse.ch/sample/76cd290b236b11bd18d81e75e41682208e4c0a5701ce7834a9e289ea9e06eb7e/
We've been seeing a flow of first stagers flying around on Twitter in the form of a OneNote document, so why don't we all have a look..
This RE shitpost was not sponsored by the OALabs, however if you don't have it already go...
